
The Finance page is your reporting workspace. It already knows every booking’s amounts, commissions, fees and taxes — and it lets you define your own variables on top: formulas like “my management fee” or “net after OTA commission”, computed per booking. You then decide how to look at those numbers — as chart lines, as table columns, as cross-table totals — and save the whole arrangement as a view you can reopen with one click.
What this is actually good for
A few things hosts build on this page, to make the mechanics below concrete:
- A real net-payout column. OTA payouts minus commission, minus cleaning, minus your management fee: define one computed variable and every booking shows what actually stays with you — not the gross the OTA reports.
- Tourist-tax reconciliation. A variable for the tax collected versus the tax owed makes the money you must pass on to the municipality visible per booking and per month.
- Owner statements. If you manage apartments for their owners, one computed variable per fee arrangement turns the bookings table into the owner’s monthly statement — export it as PDF and you’re done.
- Comparing listings honestly. Charting revenue per listing hides that one apartment has three times the cleaning costs. Chart your own “net per night” variable instead and compare what matters.
- Tracking money that lives outside the platforms. A raw variable like “cash collected” or “damage deposit returned” gives numbers you type by hand a real home — filterable, chartable and exportable like everything else.
Get oriented: views, period, filters
Open Finance in the left sidebar. The header controls decide what every chart and table on the page is looking at:
- The view selector (top left) — a view stores everything: the period, the filters, your graphs and your table columns. The dropdown also holds New view, Duplicate, Rename and Delete. Keep separate views per purpose: a monthly P&L, a tax-season view, a per-listing deep dive.
- The period chips — past 7/10/20 days, past month (the default), past 2 months, next 10 days, or Custom with explicit start and end dates.
- The filters — narrow to specific listings, booking statuses, or providers (Airbnb, Booking.com… including “Direct / Manual” for website and manual bookings).
- The report language — the dropdown next to the header sets the language used in exports.
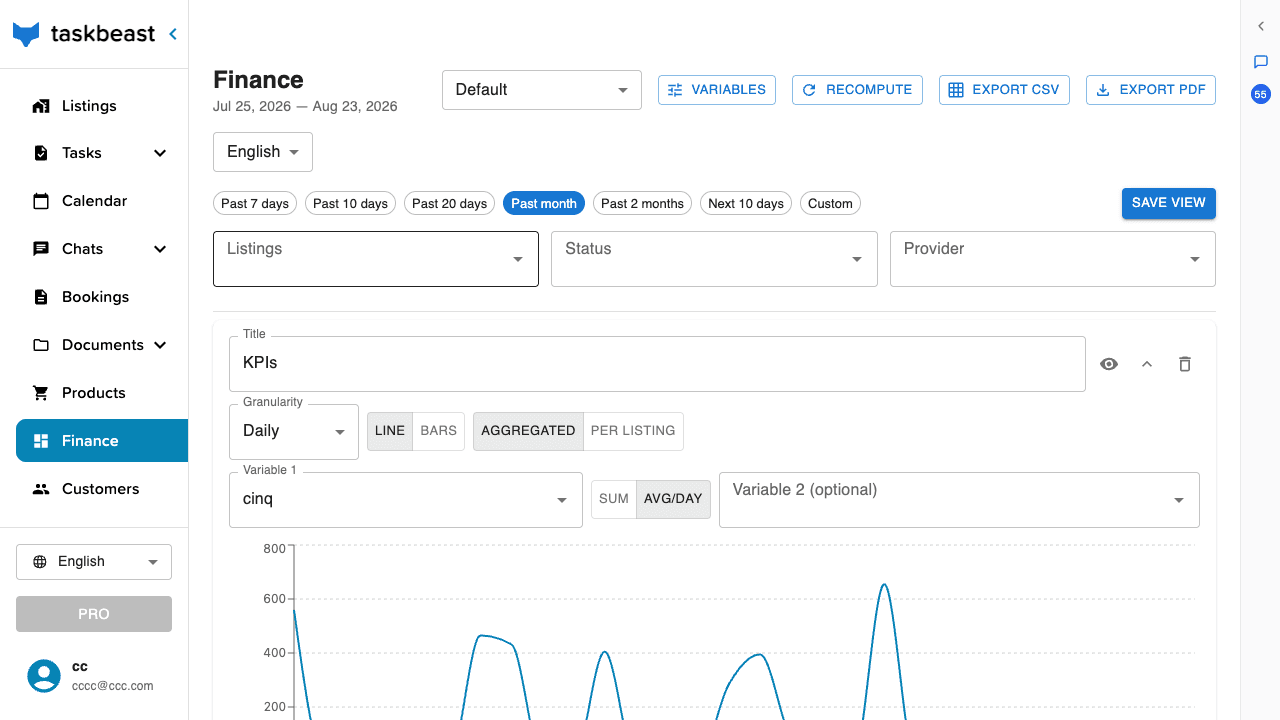
Good to know: Changing anything marks the view as dirty and a Save view button appears in the filter row. Unsaved changes are lost when you switch views — if a layout you built disappeared, that is why. Save before you leave.
Create your own variables
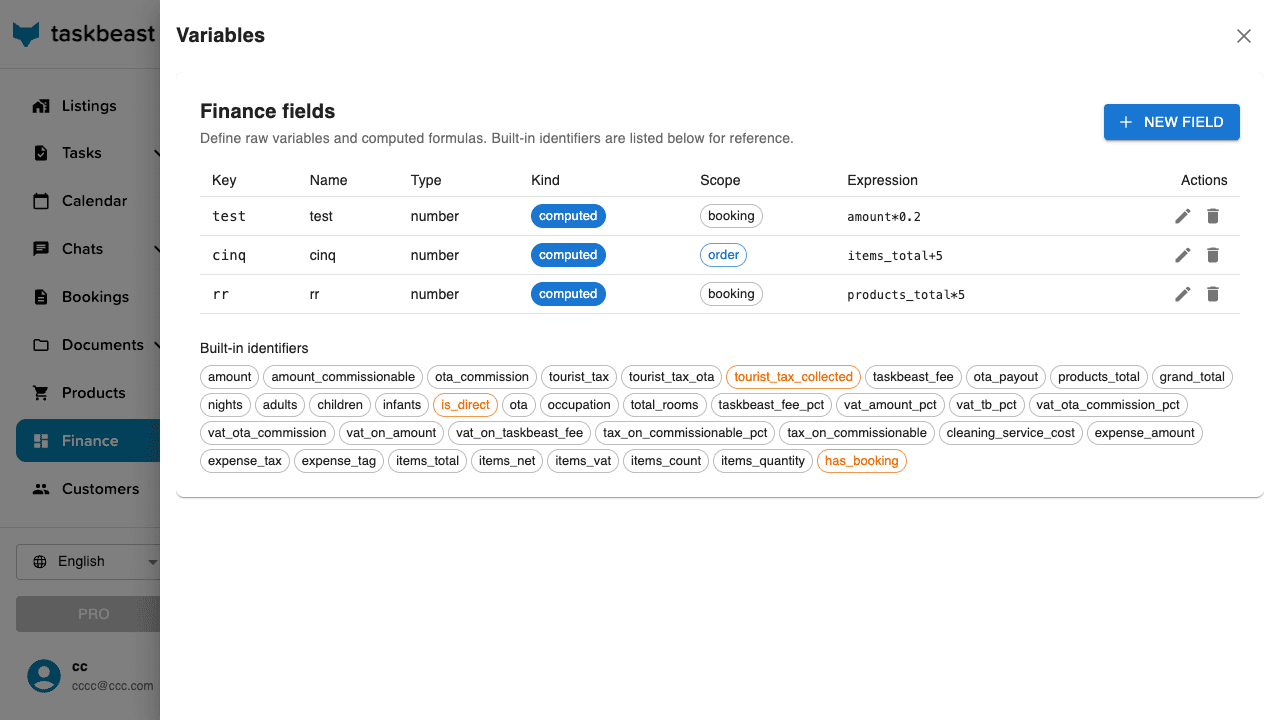
Click Variables at the top of the page to open the definitions drawer. Every variable has a key (short, no spaces — you’ll use it inside formulas, e.g. net_payout), a display name, a kind and a scope:
- Raw — a number someone types per booking: a cash payment, a refund you granted, anything Taskbeast can’t know by itself. You can also set a per-listing default in the listing’s Finance settings, so the value pre-fills and you only correct the exceptions.
- Computed — a formula evaluated per booking, like
amount * 0.2for a 20% management fee, orota_payout - ota_commission - cleaning_service_costfor a true net. Formulas can reference the built-in identifiers AND your other variables — sonet_payoutcan build onmy_fee. - Scope: booking or order — booking variables read stay data; order variables read the extras orders (their item totals, VAT, counts), useful to analyze upsells separately.
- 1Click New field, set key, name, kind and scope.
- 2For a computed variable, write the formula. Every identifier you can use is listed right in the drawer — stay amount, OTA payout and commission, tourist tax, nights, guests, occupancy, cleaning cost, expense totals, order item totals and more. Click one to see its exact key.
- 3Save. The variable is immediately available everywhere: graphs, table columns, combined sums and exports.
Good to know: Where do raw values get typed? On the booking itself — its finance summary shows every variable with Show summary enabled, and saving an override updates the numbers instantly. Computed values are cached per booking; editing a formula clears the affected cache automatically.
Where the built-in numbers come from
Formulas are only as good as their inputs, so it pays to know where each built-in identifier gets its value — there are three sources:
- From the channel, at import —
amount,ota_commission,ota_payout,tourist_tax_otaand the TaskBeast fee are read from the OTA’s own booking data the moment the reservation arrives. They are the channel’s reported numbers, not a recalculation: if one looks wrong, the fix is on the booking itself, not in your formula. - From the listing’s Finance settings — the VAT percentages,
cleaning_service_cost, your TaskBeast fee % and the tourist-tax rule behindtourist_taxare configured once per listing and applied to every booking of that listing. A wrong value here is wrong on every booking — fix it in the listing, and every formula heals at the next recompute. - Derived —
nights,adults,children,amount_commissionable(amount minus tourist tax),products_totalandgrand_total(stay plus attached extras),is_directandoccupationare computed by Taskbeast from the booking data.
Good to know: Channels report different things: a value the channel doesn’t provide stays empty and reads as null in formulas — direct and manual bookings, for instance, have no OTA commission or payout. Make formulas channel-aware with the ota identifier, which holds 'airbnb', 'bookingcom', 'vrbo', 'expedia' or 'direct': if(ota == 'direct', amount, ota_payout) gives every booking a usable net, whatever channel it came from.
Set up your graphs
Each chart on the page is independently configurable, and a view can hold several — click Add graph to append one. Per graph you control:
- Title — name it after the question it answers (“Net per night”, “Occupancy”), not the variable key.
- Granularity — daily, weekly or monthly buckets. Monthly for trends, daily for spotting individual outliers.
- Line or bars — lines read best for trends, bars for discrete sums per bucket.
- Aggregated or per listing — one combined series across all filtered listings, or one series per listing to compare them side by side.
- Variable 1 and an optional Variable 2 — plot any built-in or custom variable; adding a second draws both on the same chart, ideal for pairs like revenue vs expenses, or gross vs your net variable.
- Sum or average per day — should a 3-night €300 booking count as €300 on its check-in day, or €100 on each night? Averaging per day is usually the honest picture for occupancy-style questions.
- The eye icon hides a graph from the PDF export; the bin removes it; the collapse arrow folds it away without deleting it.
Configure the tables
Below the graphs sit the bookings table (with a Bookings | Orders toggle to switch between stays and extras orders) and the expenses table. Both are yours to shape:
- 1Open the table’s settings (the gear on the table header). Two pickers appear: Variable columns — which built-in and custom variables become columns — and Metadata columns — guest name, dates, listing, channel and other descriptive fields.
- 2Add the columns you actually read; remove the noise. Fewer columns = a readable table and a printable PDF.
- 3Drag the column headers left and right to put them in your reading order.
- 4Each section (bookings, expenses, sums) can be collapsed while you work and can be excluded from the PDF — the show/hide-in-PDF toggle sits on the section header.
- 5The table shows one row per booking in the current period and filters — for column totals across everything you see, use the combined sums section below.
Expenses and combined sums
Two more pieces complete the picture:
- Expenses — the costs you record per listing (see the listing’s Finance settings: date, amount, tag, optionally tied to a booking) show up here as their own table, filtered by the same period. Tag consistently (“cleaning”, “maintenance”, “supplies”) and the table becomes a cost breakdown.
- Combined sums — cross-table totals that mix booking columns and expense columns: revenue minus expenses, net margin, tax collected minus tax paid. Pick the columns to combine and the page keeps the arithmetic current for whatever period and filters are active.
Keep the numbers fresh, then export
- 1Computed variables are recalculated lazily. After editing booking data or when numbers look stale, click Recompute — it re-evaluates every computed variable for every booking in the current view.
- 2Export CSV for spreadsheets and accountants who want raw data.
- 3Export PDF for humans: it renders the page with a header block, honoring the per-section and per-graph PDF visibility flags — so you can keep a working section on screen but out of the report.
- 4And Save view — so next month the same report is one click, not a rebuild.
More tutorials
Prices, manual bookings and your own booking website
Set nightly prices in the calendar, register offline bookings, publish your listing on your own direct-booking page, and keep every rate plan aligned.
Get paid: Stripe, your booking website and payment tracking
Connect Stripe once and everything can collect money — your direct-booking website, payment links, product orders — with every euro tracked on the Transactions page.
Sell extras: products, orders and customers
Build a catalog of extra services once, charge guests in two clicks with tracked Stripe links, and keep a customer book that remembers everyone.